Blue Light
1. What Greenhouse Gases are, and their relationship to weather and climate
Good to read first- ‘Climate change: Where we are in seven charts and what you can do to help‘
https://www.bbc.co.uk/news/science-environment-46384067
Initial graphs- place them throughout framework
Simple diagrams of the greenhouse effect…

and the carbon cycle
https://www.youtube.com/watch?v=E8Y6L5TI_94
Relationship between CO2 and temperature over the last 400,000 years and since the Industrial Revolution- current concentrations of CO2 PPM
The Keeling Curve

info & source- https://scripps.ucsd.edu/programs/keelingcurve/
Ice core data
![This graph, based on the comparison of atmospheric samples contained in ice cores and more recent direct measurements, provides evidence that atmospheric CO<sub>2</sub> has increased since the Industrial Revolution. (Source: [[LINK||http://www.ncdc.noaa.gov/paleo/icecore/||NOAA]])](https://lh5.googleusercontent.com/kkWBPrgiZmmp9lrsT48_kEL2sqO9oSkjAFoZ_A0GYqv9n8nXU2M9eVdVsyejf55uUCsnMFJYIYJFY9eFI7AhmrLMyGA1qenZuBB7a1TftJeOXx2d2J6QRqqcKZerO0oGtongSCpmL1Y)
info & source- https://climate.nasa.gov/news/2616/core-questions-an-introduction-to-ice-cores/
*Activity*
List the main greenhouse gases and where they come from & GWP
*ACTIVITY- MMU match the GHG with the human activity game*


source; MMU

source; Opera North
* Activity *
Weather vs. climate statements e.g. Hurricane vs El-nino
Climate science: what you need to know Bill Ny- climate science 101
Global CO2 emissions data in many forms
Scientific credibility of climate deniers/sceptics

|
‘If 13950 people told you that a road wasn’t safe to go down, but 24 told you it was fine, would you still take that road?’
|

2. How climate here and elsewhere is likely to change, and how we know this
Useful video on climate change UK – coastal flooding- Sky News
https://www.youtube.com/watch?v=1k-5_WKUtBM&feature=youtu.be– 2 min 30 seconds – 4.30
Increasing extreme heat, flooding and drought, disease…
https://www.climaterealityproject.org/blog/how-climate-change-affecting-uk
How does climate change affect our weather?
https://www.youtube.com/watch?v=2J-2cGgvvII
Flood Map Friends of the Earth
https://friendsoftheearth.uk/climate-change/flood-map-england-and-wales-areas-risk-flooding
Climate Change: What Happens If The World Warms Up By 2°C?
https://www.youtube.com/watch?v=9GjrS8QbHmY
Climate Change: What Happens If The World Warms Up By 3C?
Different emission scenarios and impacts- carbon brief
NASA- Different Emission Scenarios- how they will effect temperature, precipitation, heat etc.
https://climate.nasa.gov/effects/
Future projections & tipping points (runaway climate change)
https://scied.ucar.edu/longcontent/predictions-future-global-climate


https://www.bbc.co.uk/news/science-environment-45775309
Is more extreme weather caused by climate change?

source; https://www.metoffice.gov.uk/weather/learn-about/climate-and-climate-change/climate-change/index
EXTREME WEATHER EVENTS IN 2018- FREEZE
Example slides…

America’s Big Freeze – January
The east coast of America suffered some of its lowest temperatures on record this winter – even causing frozen iguanas to fall from trees in Florida. In Embarrass, Minnesota a biting -41C was recorded. This was caused by a polar vortex, where extremely cold air is locked up in the Arctic, then bursts, and causes sub-zero conditions.
Snow in the Sahara – January
For the third time in 40 years, it snowed in the Sahara desert covering the sand dunes. In some parts of the desert there was 40cm of snow. Average temperatures in that area of the Sahara are usually around 37C.
The Beast from the East – February- March
The start of the year saw a continued cold snap in the UK. In late February and early March, Siberian temperatures collided with Storm Emma, causing arctic conditions and winds hitting 60mph – as the Beast swept right across Europe.
EXTREME WEATHER EVENTS IN 2018- HEAT

UK Heatwave June- July
Temperatures soared in the UK through June and July, well above the monthly averages, putting 2018 on course to be the country’s hottest year on record since 1976. This heatwave also sparked a record 2.2 million patients that attended A&E in July – a national record.
California’s Wildfires July- August
California had its worst wildfire in history, with masses of land, homes and buildings destroyed. The northern California’s Mendocino Complex Fire, 100 miles (160km) north of Sacramento, destroyed more than 100 homes and blackened an area about the size of Los Angeles.
Greece’s Wildfires July
Wildfires in Greece in the final week of July left 93 people dead, mainly in the Attica region. The scorching weather and frequently changing gale-force winds caused the fire to spread out of control.
3. How changes in the climate are likely to affect us in the UK and in other parts of the world
This mainly relates to flooding…
Increased housing costs (e.g. insurance, maintenance, repair) from flood risks, particularly to vulnerable areas- higher risks of flooding for many areas with high levels of deprivation/lower average incomes, particularly coastal areas.
Higher insurance premiums most of the flooding cost will be borne by insurance companies- higher insurance payouts, and in turn to changes in risk that are then captured through higher insurance premiums.
Low income groups suffer less financial resources to prepare for or recover after being flooded. Potential to disproportionately lead to major (life‐changing) impacts on a large number of low income households.
Lack of insurance amongst low income groups While most owner occupiers have building insurance, there are much lower levels of contents insurance among tenants, with many in the lowest income decile having no insurance at all.
Some of the areas that are at particular risk of flooding, in Yorkshire and the Humber and the East Midlands, are areas that have (relatively) high levels of deprivation/lower average incomes.
Explain map- areas shaded in- vulnerable to coastal erosion from sea level rise, rivers at risk of flooding
Temperature related mortality. Higher temperatures increase the number of fatalities, an effect which is heightened during prolonged heat‐waves (as observed in the European 2003 summer).
Vulnerability for certain groups e.g. the elderly, those with existing health conditions and those with access to low levels of social care.
Air pollution- Not a direct impact of climate change but… Dirty air doesn’t directly kill people. But it’s estimated in the UK to contribute to the shortening of the lives of around 40,000 people a year, -heart or lung problems.
Rising temperatures also worsen air pollution by increasing ground level ozone, which is created when pollution from cars, factories, and other sources react to sunlight and heat. Ground-level ozone is the main component of smog.
Lower yields- lower rainfall, flooding natural hazards and storms
Increased pests – insects can migrate further north as temperatures increase
Increased food bills- Much of the food purchased in the UK is part of global supply chains- On average, 11% of household expenditure
Food bill for an average family could rise by 9% by 2050 due to climate change
Greater impacts on low income households – spend a larger proportion of average household expenditure (16%) on food.
Rising temperatures will disrupt UK wildlife- The RSPB says large storms will damage habitats and that, as different species’ behaviour gets out of kilter, the balance between predators and their prey will be affected. Species may move northwards to cope, putting habitats under further pressure.
Biodiversity loss Drought also impacts wildlife. For example, climate change increases danger for bees as they rely on plants that are impacted by drought.
Climate change will negatively impact those who are most vulnerable in our society- low income, elderly, rural communities. Those with health issues- pollution, heatwaves etc.
Access to clean drinking water, fuel out-of-control wildfires, and result in dust storms, extreme heat events, and flash flooding in the States.
Lack of water- leading cause of death and serious disease
Heat stress illness—which encompasses heat cramps, heat exhaustion, and heat stroke—can occur.
Low-income residents, the young and elderly, construction and agricultural workers, individuals with pre-existing medical conditions, and people living in the center of urban areas can be more vulnerable to physical harm from heat.
Damages life and property, contaminates drinking water.
Increase in food-borne and waterborne illnesses and disease-carrying insects such as mosquitoes, fleas, and ticks, cholera, typhoid outbreaks etc.
If business as usual… By 2100, it’s estimated our oceans will be one to four feet higher, threatening coastal systems and low-lying areas, including entire island nations and the world’s largest cities, including New York, Los Angeles, and Miami as well as Mumbai, Sydney, and Rio de Janeiro.
Worldwide, farmers are struggling to keep up with shifting weather patterns and increasingly unpredictable water supplies.
Farms are more likely to face attacks from weeds, diseases and pests, which affect yield. Extreme events also threaten crop yields, such as through flooding or reduced water supply.
Health impacts of temperature extremes, specifically of heat waves. In the UK, for example, under credible climate change scenarios, the type of heat wave seen in Paris in 2003 and Europe in 2006 is likely to become a once-in-two-year event by around the middle of this century.
Increased frequency of extreme weather events, including severe storms, floods and droughts.
Increased frequency of food- and water-borne diseases.
Potential for change in the seasonal patterns or geographical distribution of some vector-borne disease.
Interactions with air pollution and effects on the seasonality and duration of aeroallergens.
Climate Change is already the greatest driver of migration and this will increase as impacts such as droughts, hurricanes and rising sea levels force people to abandon their homes.
Global warming also aggravates existing conflicts as tensions are exacerbated by resource shortages
Many land, freshwater, and ocean species are shifting their geographic ranges to cooler climes or higher altitudes, in an attempt to escape warming.
Changing seasonal behaviors and traditional migration patterns, too.
Many still face “increased extinction risk due to climate change.” Climate is changing too quickly for them to adapt.
Indeed, a 2015 study showed that vertebrate species—animals with backbones, like fish, birds, mammals, amphibians, and reptiles—are disappearing 114 times faster than they should be, a phenomenon that has been linked to climate change, pollution, and deforestation.
Heatwave: Is there more crime in hot weather? – 19 July 2018
Flooding causes major disruption across north of England – 1st August 2019https://www.bbc.co.uk/news/uk-44821796
Whaley Bridge dam emergency – live: Reservoir wall at ‘high risk’ of collapse as entire town near Manchester evacuated amid major flood fears– 1st August 2019
Heatwave fuels record pressure on hospital A&E departments – 8th August 2019
The UK has already had more wildfires in 2019 than any year on record – 23rd April 2019

1. Ask participants to work in groups to discuss the top three things that make them happy
Write their answers on a board or on paper. Then use these answers to discuss how climate change will affect those areas, and ask how they might be improved and reduce carbon emissions at the same time.
2. Split into twos/threes and discuss the category given to you. Answer the following questions…
- How will climate change contribute towards your category?
- What regions will be most affected by this? Who will be most affected?
- Can you give an example of this?
Examples include
Natural Hazards & Weather
Healthcare
Food
Threats to Wildlife
Interactive maps for climate vulnerability-
https://www.climatejust.org.uk/
‘Climate change: Heatwave made up to 3C hotter by warming’
https://www.bbc.co.uk/news/science-environment-49205072
‘How much warmer is your city?’
https://www.bbc.co.uk/news/resources/idt-985b9374-596e-4ae6-aa04-7fbcae4cb7ee
Images
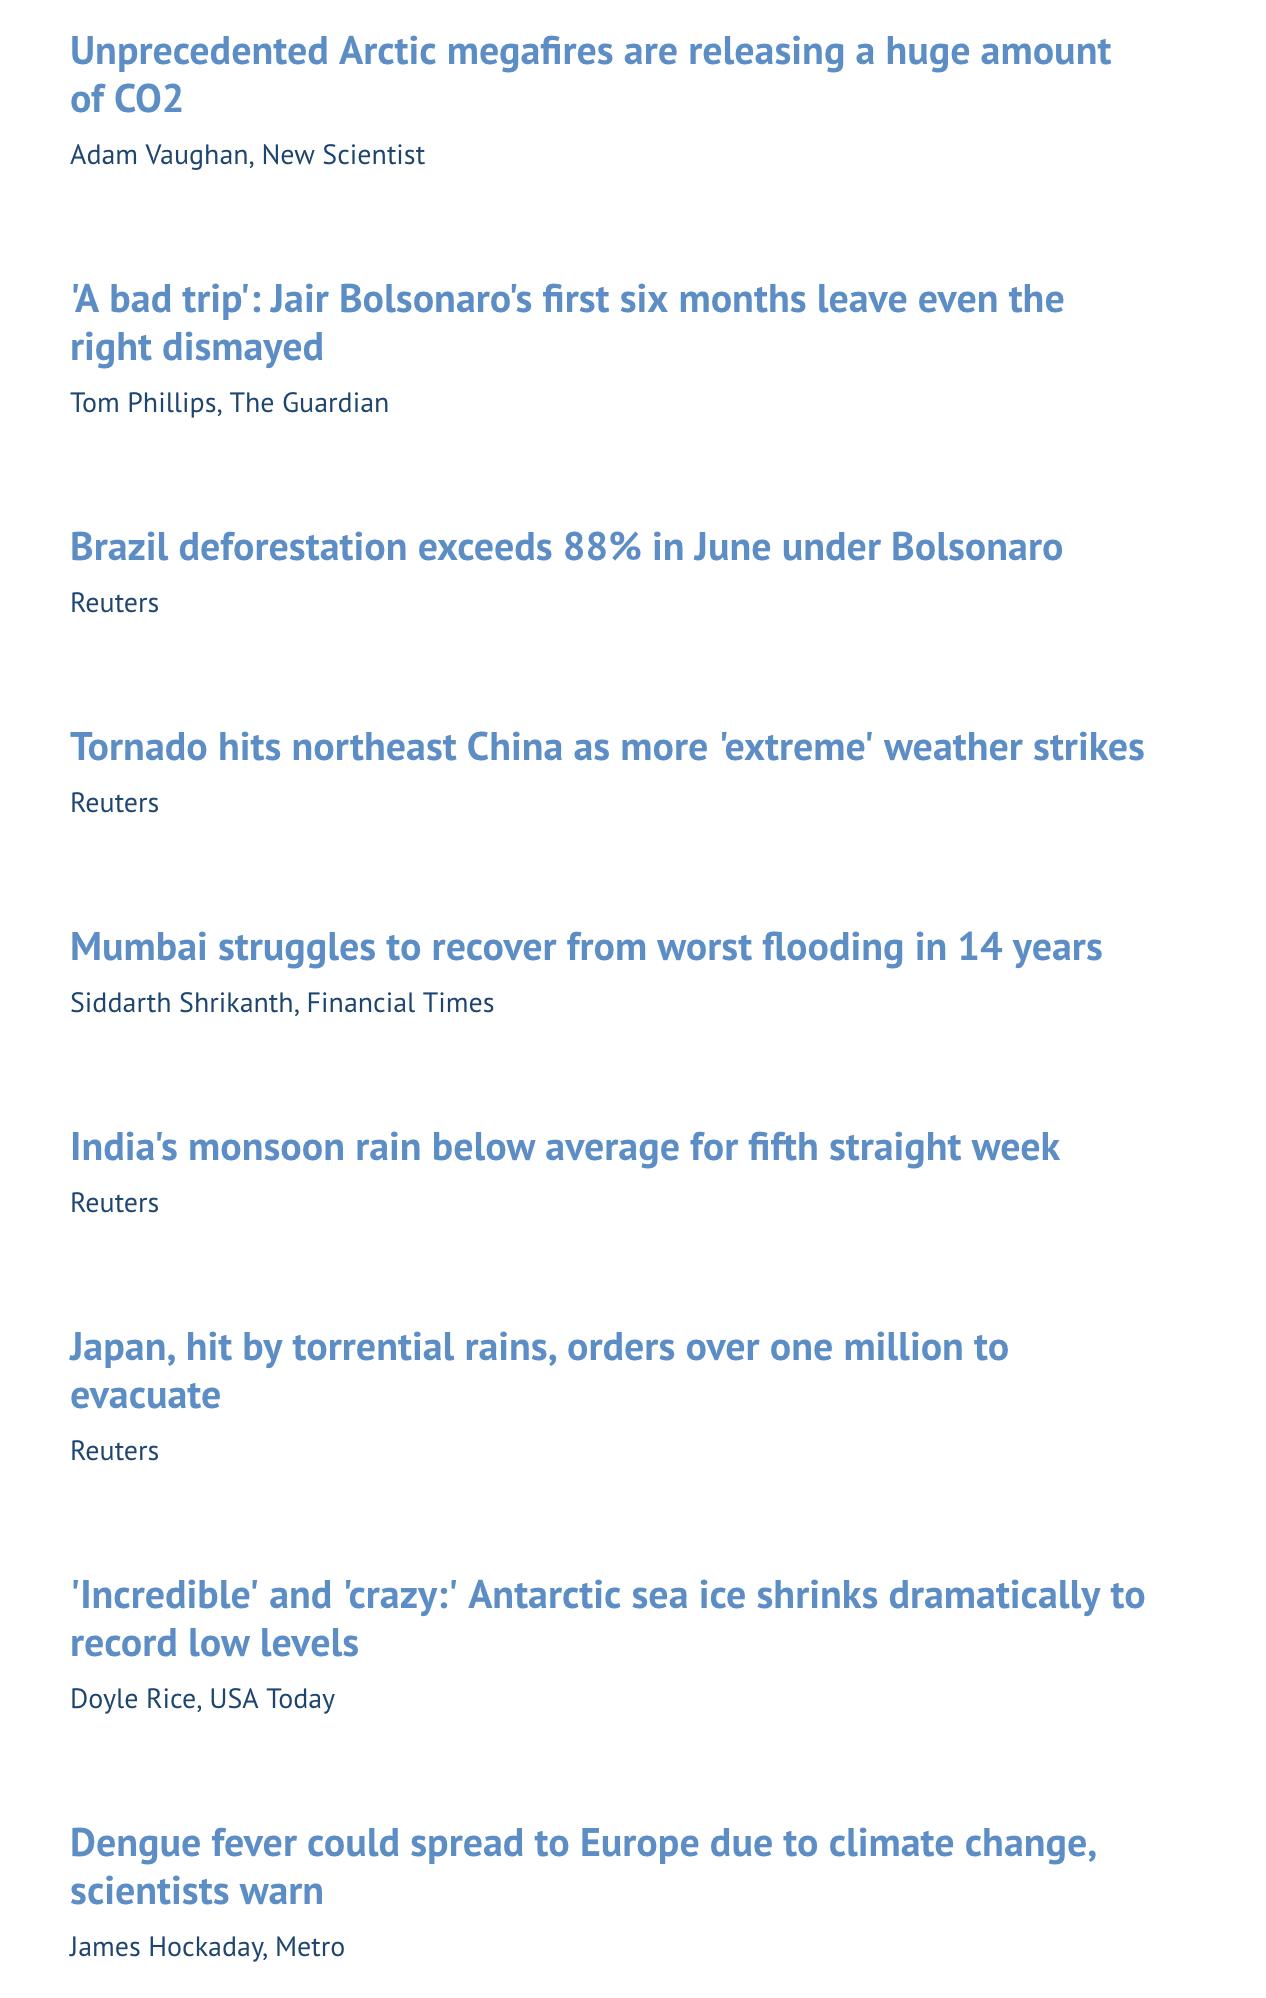
‘Just another news day’.
4. How our actions impact on the amount of greenhouse gases produced and the impact that they have
What is the carbon footprint of blue light made up of?
– Buildings
– Waste
– Vehicle emissions
– Energy use
– Procurement
– Water use
Fire

source; GMFRS
Ambulance
‘The NHS produces around 22.8 million tonnes of carbon emissions each year, which accounts for approximately 25 per cent of emissions made in the public sector.’ – https://www.plymouth.ac.uk/news/pr-opinion/why-its-important-to-lower-carbon-emissions-within-the-ambulance-service
Together across the country, they use 150,000 litres of diesel on a daily basis and the national ambulance fuel bill has increased by up to £26 million annually year-on-year for the past few years. – https://healthbusinessuk.net/features/ambulance-services-unite-carbon-reduction
Many of the ambulance services in England have looked at their carbon footprint in order to understand where their direct carbon emissions come from. In Scope 1 and Scope 2 emissions’ (direct/purchased emissions) assessments, it was established that over 60 per cent of emissions come from their fleets and the remaining 40 per cent coming from their estates. – https://healthbusinessuk.net/features/ambulance-services-unite-carbon-reduction
Police-
pg 19- improvements but what the carbon footprint is made up of
1. Carbon Footprint calculator – https://footprint.wwf.org.uk/#/ – good to do before the course?
2. Walk the walk
https://climateoutreach.org/resources/walking-the-walk/
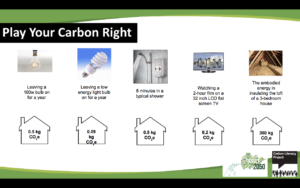
3. Use the Carbon Footprint of Everything and other sources to identify the carbon footprint of key items your participants may consume or activities they take part in over a year. Ask them to rank them from lowest to highest. This can help with gaining an instinct of the carbon costs of day to day
4. ‘Play your carbon right’
GMFRS game-
How green is your parcel
https://www.bbc.co.uk/news/science-environment-47654950
More Britons travelled abroad last year than any other nationality, according to official data from the international trade body for aviation.


5. What we can do to reduce our impact and the benefits and disadvantages of taking action
Good overall resources hitting personal key areas-
https://1010uk.org/carboncrush
http://staging.carbonliteracy.com/so-youre-carbon-literate-what-next/
https://1010uk.org/carbon-crush-content/transport
Flight off-setting
https://www.theguardian.com/travel/2019/aug/02/offsetting-carbon-emissions-how-to-travel-options
“As the table shows, nationally a staggering 60% of journeys of between one and two miles are taken by car.
Indeed, there is an even more startling figure in GM – that ⅓ of all journeys of one kilometre or less are driven. ”

http://shrinkthatfootprint.com/food-carbon-footprint-diet
https://davidsuzuki.org/queen-of-green/food-climate-change/

http://www.greeneatz.com/foods-carbon-footprint.html (ignore carbon footprint of specific foods, think lamb one is wrong?)

Eating locally and seasonably game- opera North game

Switching to a renewable energy provider-

Retrofit
Energy Efficiency measures
https://www.realhomes.com/advice/ways-to-save-energy-in-a-period-home

RESOURCE CONSUMPTION/ WASTE
Live Better: Reduce, reuse, recycle
https://www.theguardian.com/lifeandstyle/series/live-better-reduce-reuse-recycle
Clothing
Charities- reusing your stuff
http://staging.carbonliteracy.com/great-charities-encouraging-reuse/
Recycle for Greater Manchester
https://recycleforgreatermanchester.com/how-do-i-waste-less/

MMU activity-
Split into groups and each given one section
-
TRANSPORT/ TRAVEL
-
FOOD
-
DOMESTIC/ ENERGY USE
-
RESOURCE CONSUMPTION/ WASTE
Discuss
-
Carbon emission source
-
Actions to reduce it
-
Benefits/barriers of taking action
Matrix of actions- hard vs easy, high impact vs low impact


Green light for action
-
You have the green light to try new things at work with your managers support.
-
With a partner talk about your actions and how you might implement them.
Spheres of Influence
-
Where do you have the most power/influence in your life to make a difference in regards to reducing carbon?
-
Who can *organisation*/your team influence to take action on climate change?
-
What are the barriers?
-
How can you overcome them?
Create an action plan from these activities^ 2 workplace actions- how you can put them into action.
MMU– Visualization/Futures thinking activity
Participants are separated into groups of four and use flipchart paper to draw what a sustainable low carbon world would look like. Create prompt questions on stack of cards, i.e Where will our energy come from? How can we get there? What is your role in getting us there? What is the relevance to your area of study/role at work?
Happiness game
-
What gives you and your family the most happiness in life?
-
What do you plan to do when you retire?
-
How will these changes to the climate affect things you enjoy and love?
Five things people can do for a ‘healthier environment
All the different cases for Climate Action– A Government Official’s Toolkit inspiring urgent climate action

Police
https://sustain.ubc.ca/sites/sustain.ubc.ca/files/GCS/2018_GCS/Reports/2018-

Ambulance
‘it was established that over 60 per cent of emissions come from their fleets and the remaining 40 per cent coming from their estates’
– Electric vehicles e.g. nissan leaf for non-life threatening services
– Carbon champions
– Cycle response units
– Tyre valve pressure indicators on all vehicles
– Vehicle technologies on trial across the country include: methanol fuel cell; hydrogen fuel cell; solar panels on the roofs of vehicles; electric vehicles; hybrid vehicles; aerodynamic assessments; brake regenerative technologies
https://healthbusinessuk.net/features/ambulance-services-unite-carbon-reduction
Fire – similar ^
https://www.cheshirefire.gov.uk/Assets/cheshire%20frs%20lacm7%20cmp%20v%201.0.pdf
Many fire stations e.g. GMFRS already have achieved significant carbon savings- low hanging fruit, how can we make deeper cuts?
6. What we are already doing locally and nationally
Paris COP21
Deal united all the world’s nations in a single agreement on tackling climate change for the first time in history.
‘Aims to hold the increase in temperature to 2 degrees … and pursue efforts to limit temperature increase to 1.5C’
https://www.bbc.co.uk/news/science-environment-35073297
IPCC
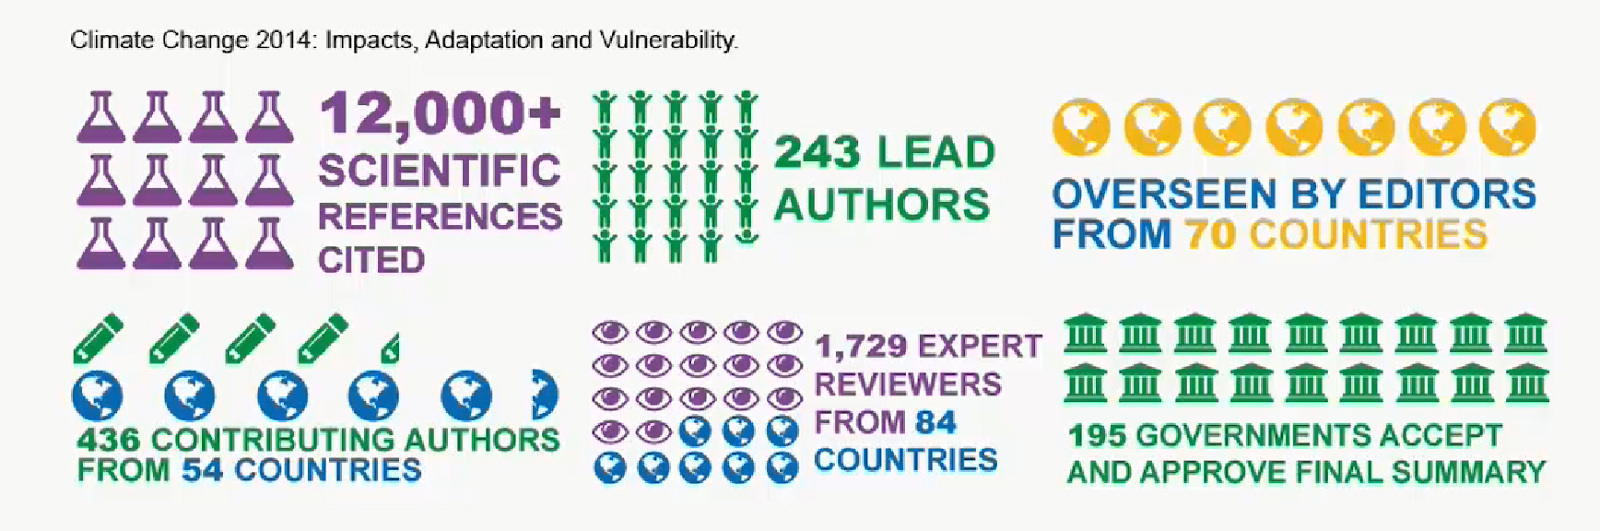
The Intergovernmental Panel on Climate Change (IPCC) was established in 1988 by the World Meteorological Organization (WMO) and the United Nations Environment Programme (UNEP) to assess climate change based on the latest science. Through the IPCC, thousands of experts from around the world synthesize the most recent developments in climate science, adaptation, vulnerability, and mitigation every five to seven years.
In October 2018 IPCC special report on the impacts of global warming of 1.5 °C above pre-industrial levels and related global greenhouse gas emission pathways, in the context of strengthening the global response to the threat of climate change, sustainable development, and efforts to eradicate poverty.
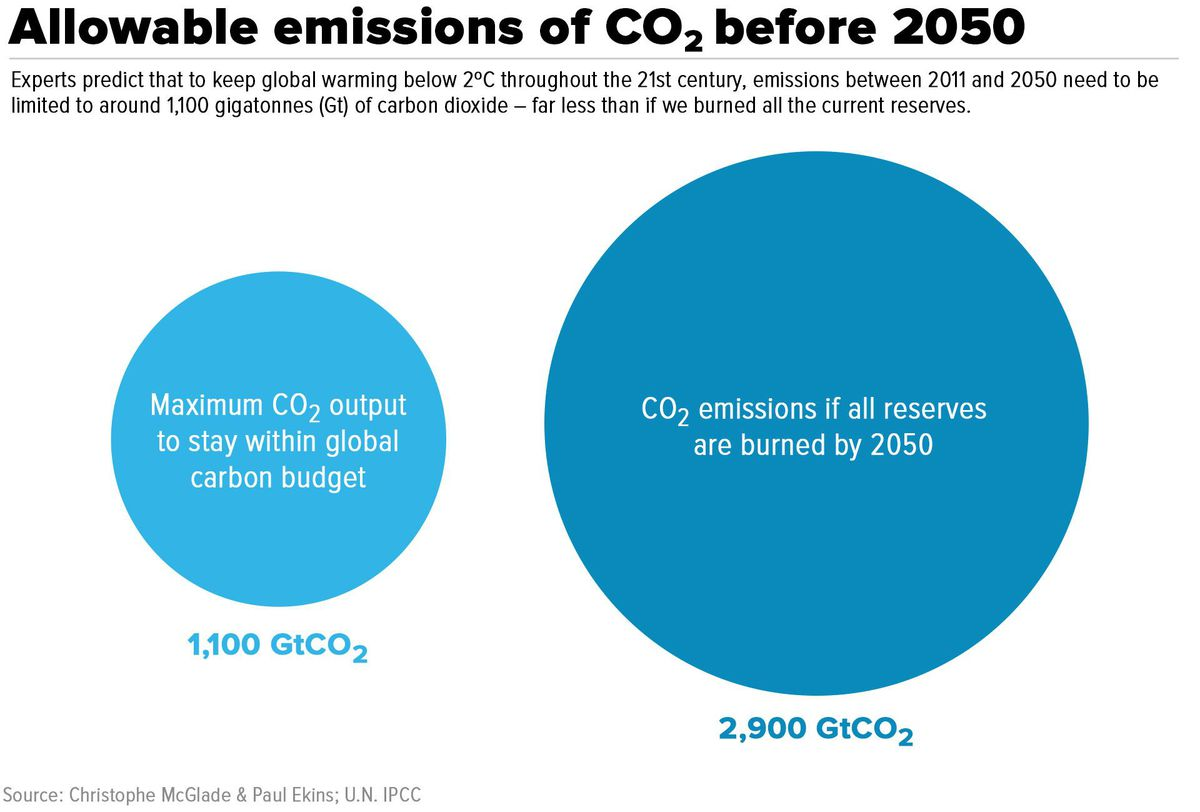
To summarise this report into one key finding was that, if we are going to have a reasonable chance of keeping warming to 1.5 degrees, we have just over 10 years to cut global emissions by 50% based on 2010 levels. We then have another two decades (until 2050) to reach zero net emissions.
We have already burned through a large portion of our carbon budget, and recently at an alarming rate. It is clear from the report that if emissions continue unabated, even with countries’ current climate commitments being fully implemented, we blow through the budget in just about a decade’s time for a likely chance of limiting warming to 1.5°C. Doing so would expose the world to even more severe heat waves, sea level rise, extreme rainfall and other climate impacts. The IPCC makes it clear that we can no longer emit at our carbon-intensive rate if we are to avoid the worst climate impacts. We must instead rapidly turn around our emissions trajectory.
UK Climate Change Act 2008– Ambition 80% carbon reduction target by 2050
IN 2017- UK achieved 40% reduction of 1990 from levels… BUT excludes shipping, aviation, imports, could be as little as only 10% including them…
https://www.manchester.ac.uk/discover/news/new-net-zero-emissions-target-wont-end-uks-contribution-to-global-warming–heres-why/ *DO WE WANT TO PUT THIS EARLIER IN THE COURSE AS IS A BIT DEFLATING?*
*New Target*

https://www.theguardian.com/environment/2019/jun/11/theresa-may-commits-to-net-zero-uk-carbon-emissions-by-2050 – June, 2019
‘UK greenhouse gas emissions: fast progress but not yet enough to meet future targets’- June, 2019
https://fullfact.org/environment/uk-greenhouse-gas-emissions-fast-progress-not-yet-enough-meet-future-targets/

https://www.theguardian.com/environment/2019/jun/18/uk-climate-plan-unclear-says-european-commission– Jun, 2019
UK current targets and progress
Chief Exec CCC, Chris Stark- VIDEO
https://twitter.com/ClimateAdam/status/1148952463082500096
Latest report
https://www.theccc.org.uk/wp-content/uploads/2019/07/2019-Progress-Report-Summary.pdf
Manchester has committed to:
Emit only 15 million tonnes CO2 during 2018-2100 – our ‘carbon budget’
Reduce emissions by at least 13% year-on-year
Become a zero carbon city by 2038, at the latest
These targets were set based on Manchester making its fair contribution to the Paris Agreement and were developed by the Tyndall Centre for Climate Change Research.
In Manchester- MACF report 2009
2038 targets http://www.manchesterclimate.com/sites/default/files/ZeroCarbon_AR_19_1.pdf
Green Energy Switch in MCR
Collective buy in of renewables e.g. solar- low carbon hub
Metrolink
Electricity North West reduced their own emissions by 10% last year
https://www.anthesisgroup.com/scatter-carbon-footprint-reduction-tool
Fire
https://manchesterfire.gov.uk/media/1093/gmfrs_ar1617_low.pdf
KILBARRACK FIRE STATION, Dublin Green Plan
Merseyside Fire & Rescue Service. Environmental report:
https://www.merseyfire.gov.uk/aspx/pages/reports/pdf/Environmental_Report_MFRS_AW.pdf
Police
https://www.emexlondon.com/reduction-in-emissions-at-surrey-police/

Source: https://www.avonandsomerset.police.uk/media/29723642/sustainability-strategy-to-2021.pdf
Surrey & Sussex Police-
https://www.emexlondon.com/reduction-in-emissions-at-surrey-police/
Over 30 projects have been delivered to reduce building and transport-related emissions so far and we have a number of projects in progress to establish robust energy monitoring, controls and efficiency:
Building Energy Management systems upgrade to control heating, cooling and ventilation efficiently;
Energy sub-metering at electrical distribution board level to avoid unnecessary usage;
Low energy LED lightings and control;
Automatic air-conditioning control with timer and occupancy, window/door open sensor;
Hot water demand sensor installation;
Efficient burner replacement and control management;
Dynamic burner management;
Efficient chiller replacement;
Solar PV installation
60 unmarked fully electric vehicles are deployed across the force, replacing existing diesel-fuelled vehicles- save up to £120,000 for each force over five years, just from the reduced fuel, servicing, maintenance and repair costs.
A charging infrastructure partner installed 70 charge points at 19 police sites across Surrey and Sussex under the Central Southern Regional Framework. This framework, run by Hampshire County Council, gives local authorities and other public bodies in the South of England the ability to procure and install charge points rapidly, without running their own tendering exercises.
7. Where we can go to get help. What help is available to us?


See ‘What we can do to reduce our impact’ section
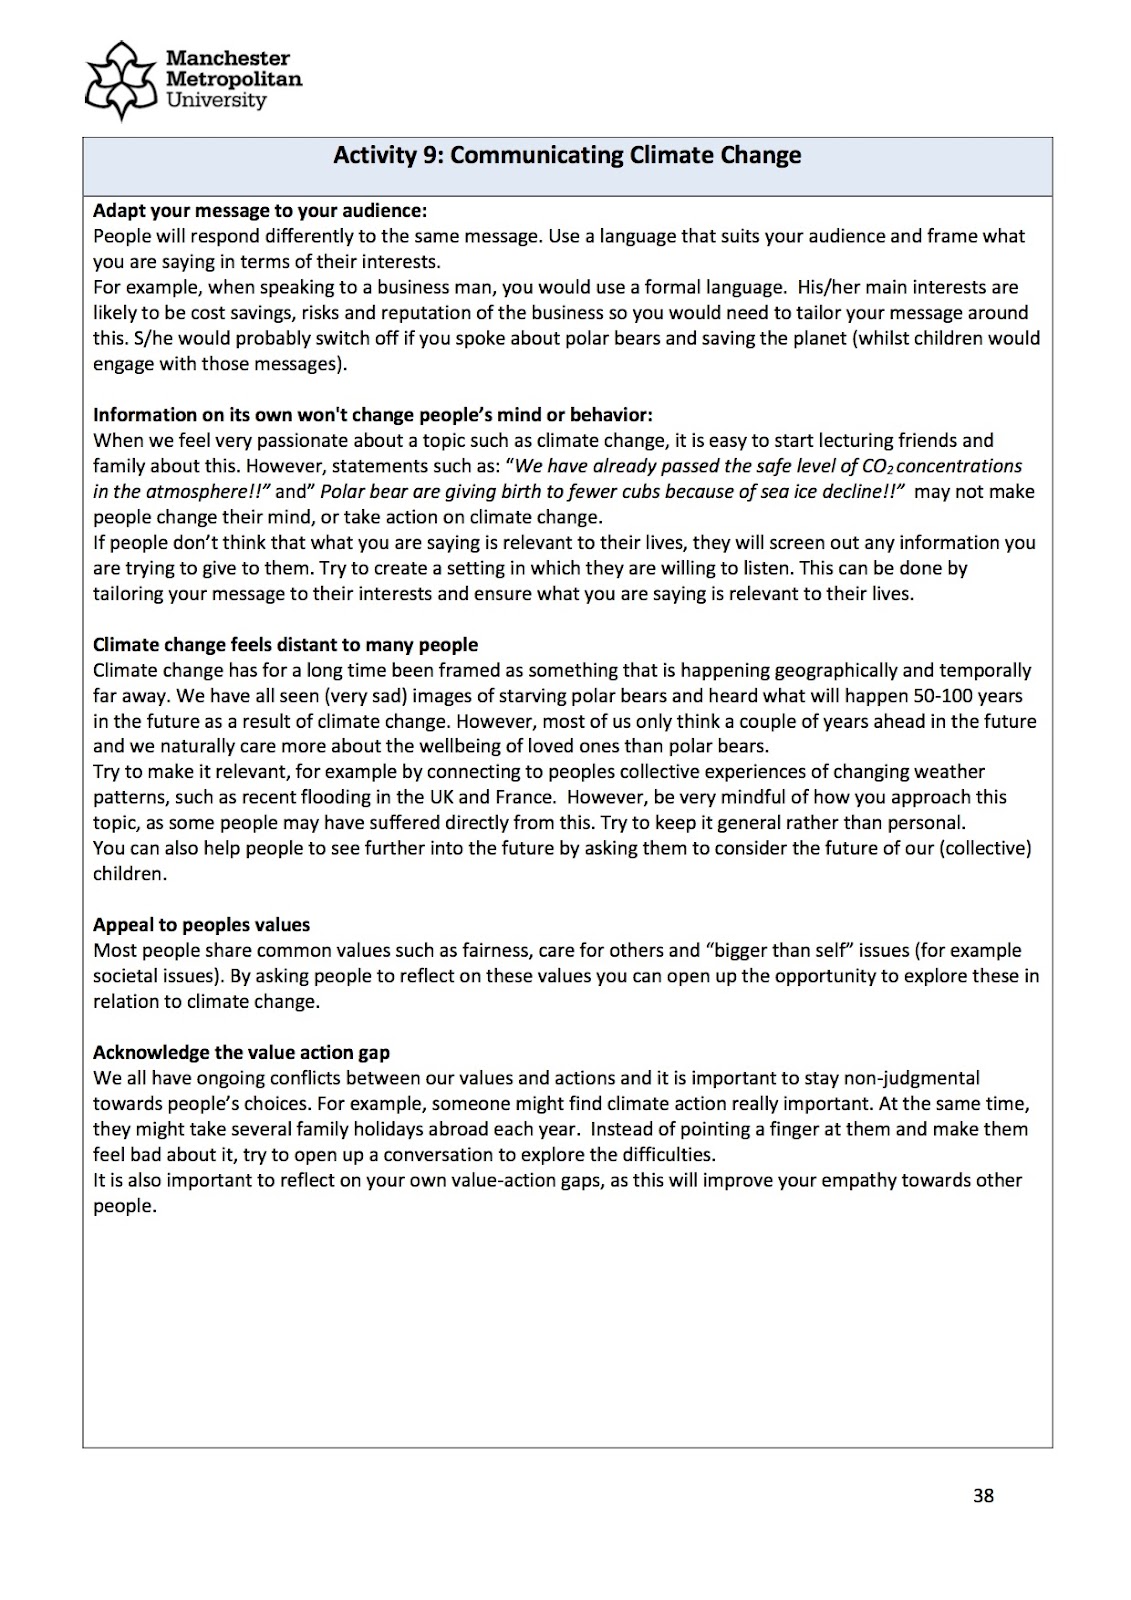
8. How we can motivate others to take action, including gaining the confidence to express our Carbon Literacy to others?
‘The climate paradox.’
https://www.youtube.com/watch?v=ovfOURebDjc&feature=youtu.be
Telling the story – how to communicate about climate change
1. What are your experiences of this?
2. What challenges might you come up against?
3. How might you overcome these?

Activities


– You want to encourage your employer to take action on climate change- how would you influence him/her to do this?
– You are discussing with your family where you should go on holiday. How will you persuade them to opt for a low carbon holiday as opposed to flying (e.g. a holiday in the UK, or taking the train instead of flying).


Values
Videos
Global Weirding – I’m just one person what can I do about climate change?
Articles
Science Daily – Eating beans instead of beef would sharply reduce greenhouse gasses
Articles
Friend of the Earth – Shout about Climate Solutions Together
TUC – Greening the workplace: Environmental rights at work
Business in the Community – Tackling Climate Change
Videos
United Nations – Co-benefits of climate action and clean energy
Welcome Trust – Climate change action, the good news
Climate Connections – Economic benefit of climate action
Articles
European Commission – Benefits of climate action
C40 Cities – Benefits of climate action
Images/Graphics
Carbon Map – Which countries are responsible for climate change and which will be most vulnerable to the impacts, interactive map
Environmental Justice Atlas –The EJ Atlas collects stories of communities struggling for environmental justice from around the world
Articles
The Conversation – Climate justice and its role in the Paris Agreement
Guardian – Portuguese children sue 47 countries
Activities
Who’s emitting all the greenhouse gas? Ask participants to order 10 greenhouse gas emitting countries overall, and per capita. (This can also be to discuss climate justice by ordering them for a third time by how vulnerable these countries are to the impacts of climate change, and you could also ask them to order by historical emissions!) Discuss what the reasons for the differences are and how the participants feel about the
differences.